
Using colors to emphasize information is great. They help distinguish the content and make it easier to identify while making it more stylish for the users. But it needs to be a booster –something that supports and enhances the current content–, and not something that provides all the information.
People suffering from partial sight, color blindness, or visual deficiencies, may have problems differentiating certain colors. If all the information is color-based, then they won't be able to access it.
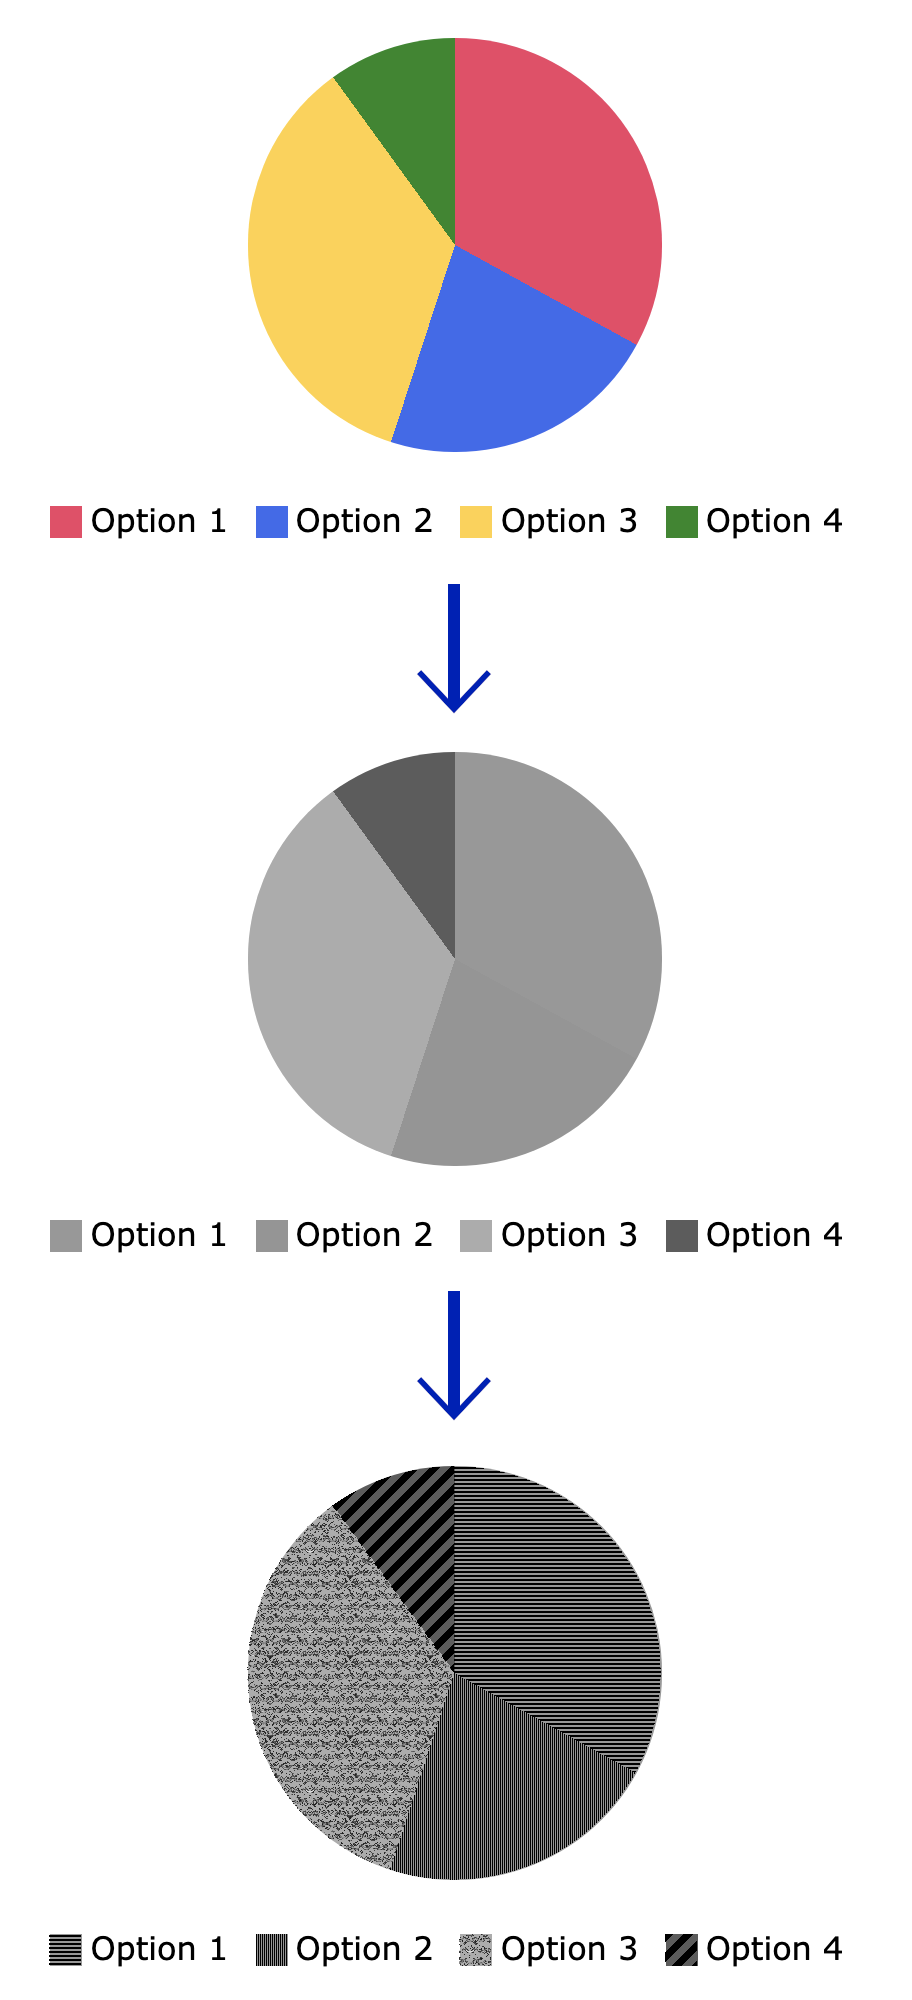
Let's illustrate this by taking the last example from the previous post:
That is a pie chart with more-or-less easy to distinguish colors but, when you mouseover, it turns into a grayscale mess.
While graphs may be more of an edge case, there are many other elements and components that we use every day and could potentially have a similar issue. For example:
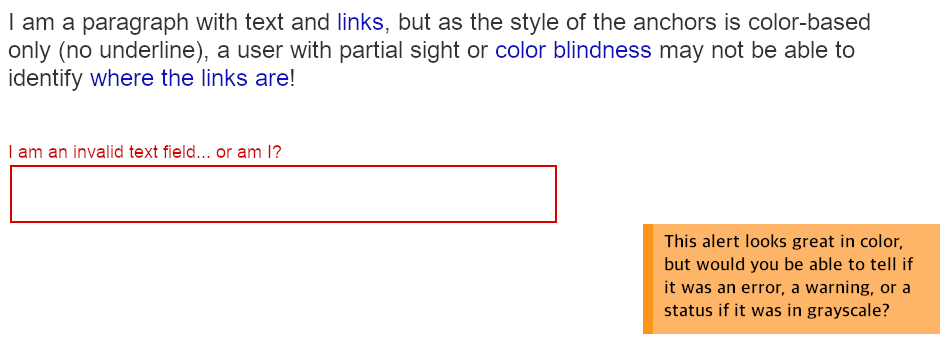
- Alert/Toast messages may be difficult to distinguish unless they specify what type they are.
- Required/invalid fields should be more descriptive than just a red color.
- Links need to pop among the surrounding text... even if everything was in grayscale.
There are different techniques to solve these problems. All of them based on the idea of having something more than just color to emphasize the content:
- Adding images or icons.
- Adding a textual indicator.
- Add other types of visual indicators.
- Adding a background pattern.
- Combine some of the above...
Let's see them in more detail in the following sections.
Adding a visual indicator or icon
Adding an icon or image next to the content may be a good solution in some cases. It will boost the use of color to convey information, and it's fairly easy to implement.
A stock ticker is a classic example of this problem and solution. If the stock value is up, the numbers are displayed in green, and if the value is down, they are displayed in red. Which may not be a good thing for users with partial sight or colorblindness:
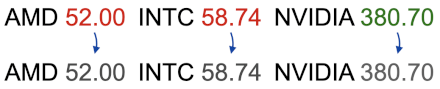
We need to communicate textually or visually what each color means. In the case of the stock ticker, an arrow up or down would do:

Adding that up/down visual indicator provides extra reinforcement for what the change in value was and makes the content more accessible.
In CSS, we can add the icon using the pseudo-elements ::before and ::after, either by using an actual image or setting the icon as a Unicode character:
/* Option 1: adding an actual icon */
.price.positive::before {
  content: "";
  display: inline-block;
  width: 1em;
  height: 1em;
  background: url(up.png);
  background-size: cover;
}

/* Option 2: using directly the content */
.price.positive::before {
  content: "▲";
}
.price.negative::before {
  content: "▼";
}
Note that this could be achieved by adding the image using HTML, but this series is focused on accessibility using CSS.
In some cases, the use of this icon could be sufficient to indicate the existence of the content (e.g. a link with an external icon.)
Adding a textual indicator
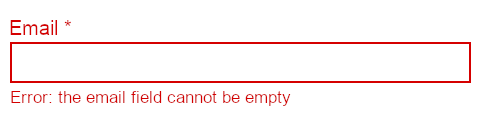
This could be helpful to highlight some form fields and their status (e.g. when there is an error):
The CSS implementation for this would depend on the HTML. But in general, it will be a similar technique to the one explained above. Just using text instead of icons or images.
Note: although textual cues can be added with pseudo-elements in CSS, it is better to do it directly in HTML as that text may not be accessible to some users through their assistive technology.
Adding other visual indicators
Not all of the visual indicators have to be text or images. There are others that are more extended and generally understood by all the users, and that can be used to.
Some examples of this:
- Links are generally underlined.
- Required fields have an asterisk (
*) next to the label. - Buttons have a border or solid content.
- Inputs have some border...
For example:
>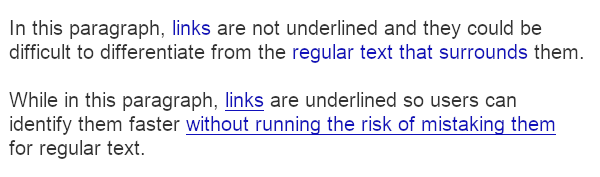
The links on the first paragraph are not underlined and, for people suffering visual deficiencies, they may be difficult to differentiate from the regular text that surrounds them.
This is a CSS example of a link that is underlined in normal state, but we remove the underline on hover:
a, a:link {
  text-decoration: underline;
}

a:hover {
  text-decoration: none;
}
Another example from above would be having an asterisk (*) next to the label of a required field. For that we can use the ::before or ::after pseudo-elements:
label.required-field::after {
  content: "*";
}
Add background patterns
This could be extremely helpful for graphs and charts... which is more of a JavaScript/SVG/HTML kind of thing. But CSS still may have something to say.
The idea would be not to have just a color but add a (semitransparent) image that will differentiate sections. That way, people with color blindness would be able to separate the sections better.
The whole "add patterns to graph" part could require a little bit of JavaScript, but it can also be achieved only with CSS and HTML by adding a checkbox before the graph and using the ~ combinator (but that's a different story).
The CSS for this would be the same as any background image:
.chart .section {
  background-image: url(pattern.png);
}
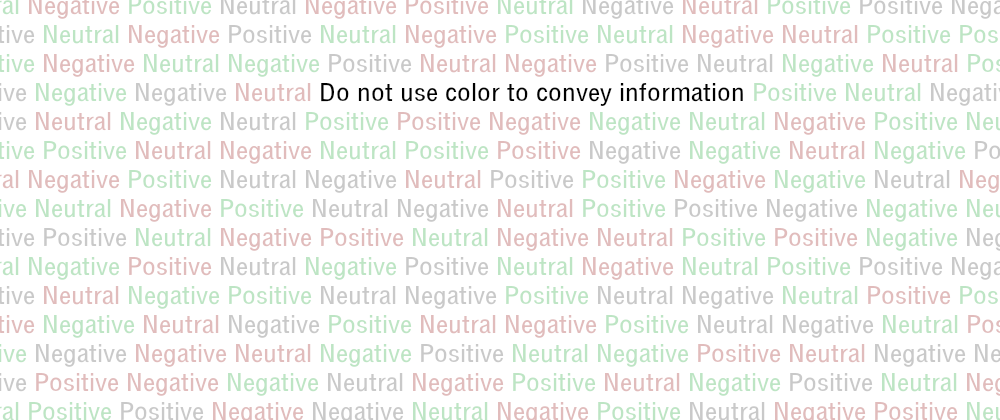
Do not just use color to convey information.